
Dispatches
Product launch

Catalog in. Measures out.

Athena reads your raw database, asks you a few sentences about your business, and writes the definitions your dashboards and your AI both use, so they finally give the same answer.

Dashboard and chat, different numbersQ4 2026All storesDashboard return rateXChat return rateYSame questionDashboardChatDefinitions builtWhat countsWhich storesOne version of the truthGuessing from column namesNever saw the definitionsDifferent version of the truthWhich one is right?WarehouseorderscustomersreturnsstoresproductsregionsRaw catalog: tables, columns, relationships, sample valuesBusiness contextWe sell parts to stores.Revenue is net of returns.A customer is a store, not a person.ordersreturnsstoresproductsONE DEFINITIONNet RevenueSUM(orders.amount) -SUM(returns.amount)StoredimensionRegiondimensionsame number, both placesDrafted from your data.Athena drafted a joinJoin orders to customers onorders.store_id = customers.idLegacy table: no foreign key recordedInferred from column names and sample valuesWAITING FOR A PERSONAccept or edit the proposed join keyConnection unclear · human review requiredA person decides.ordersreturnsstoresONE DEFINITIONReturn Ratereturns / ordersDashboardsameChatsamesame number, both placesOne answer.Catalog in. Measures out.athenaintel.com
Fig. 01The launch in 35 seconds, from the question to the landing line: “Catalog in. Measures out.”
Catalog in. Measures out.

At almost every company trying to use AI with data, this meeting happens.

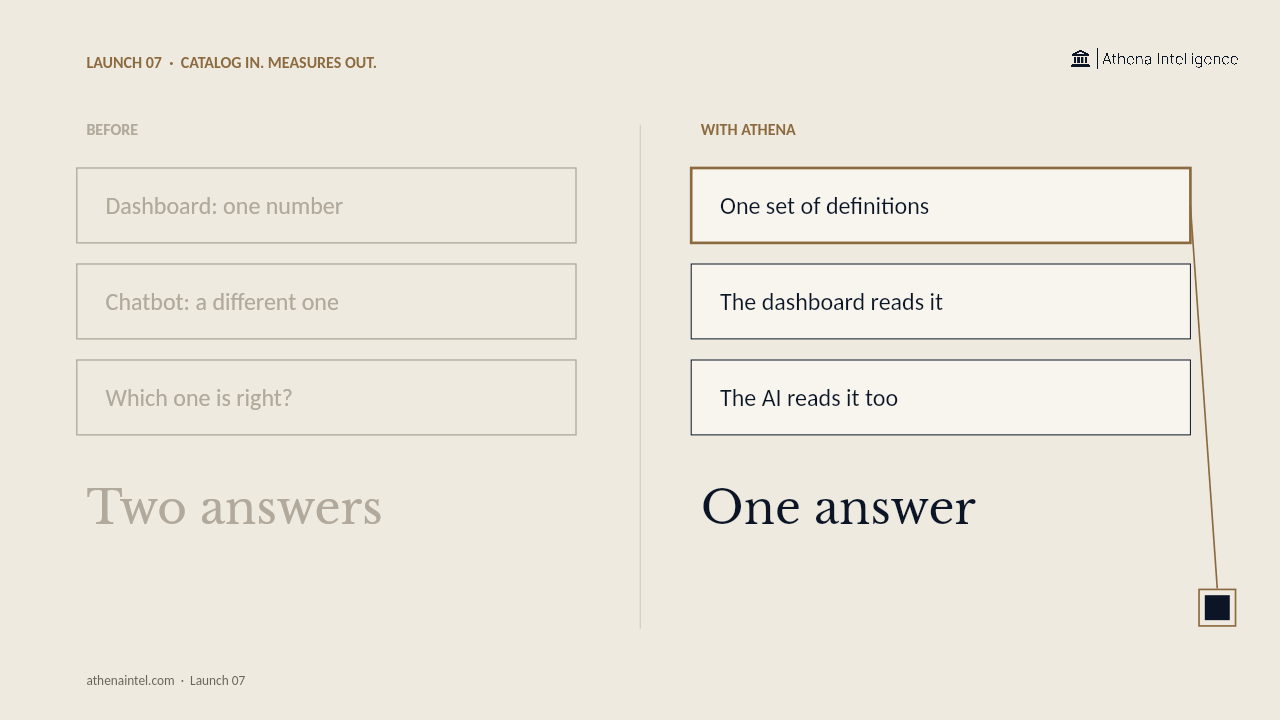
Someone asks the chatbot for last quarter's return rate. The dashboard on the wall shows a different number. Everyone turns to the data team.

Nobody did anything wrong. The dashboard uses definitions someone built years ago: what counts as a return, which stores are included, when the quarter starts. The chatbot never saw those definitions. It is guessing from column names. Of course the numbers differ.

The fix is not a smarter chatbot. It is giving both of them the same dictionary.

That dictionary is called a semantic model. It says, once and for everyone: net revenue means this. The fiscal quarter starts on this date. A store belongs to this region. When the dashboards and the AI read the same model, they give the same answer, and you can click any number to see where it came from.

The problem is that building one by hand is slow, so most companies never finish.
Catalog in. Measures out.

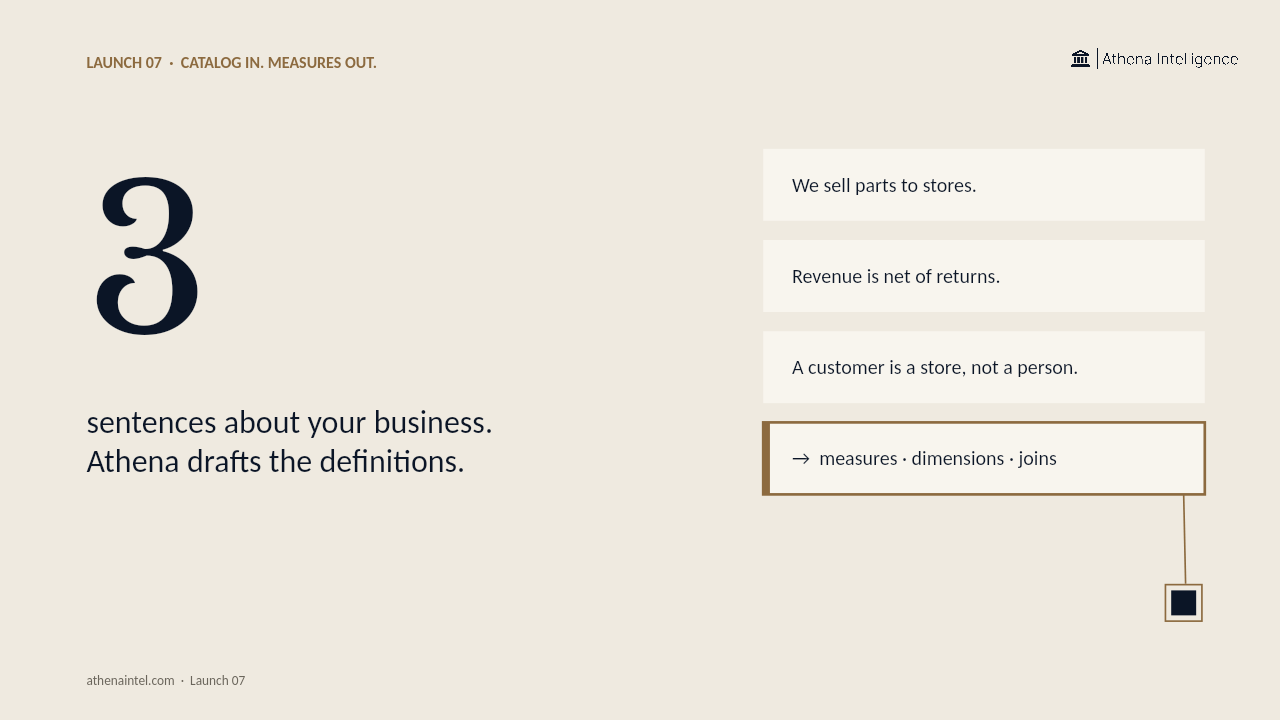
So Athena drafts it for you. Point it at your warehouse, say Snowflake or Databricks. It reads the tables, columns, relationships, and sample values. Then you describe the business in a few plain sentences, for example:

We sell parts to stores. Revenue is net of returns. A customer is a store, not a person.

From that, Athena writes a first draft: the ways you slice the data, the numbers you measure, and how the tables connect. Every definition shows the query behind it and the tables it came from. You read and edit it like a document.

Above the numbers, the nouns. Businesses talk in things, not tables: a brand, a plant, a legal matter, a deal. Athena can model those too, so one question can pull from a database and a set of documents at once.
Catalog in. Measures out.
What to plan for

Some older tables do not record how they connect to each other. When Athena cannot tell for sure, it flags the connection and asks a person instead of guessing.

People and AI should be looking at the same numbers. Now they can.

Catalog in. Measures out.

Three sentences draft the semantic model

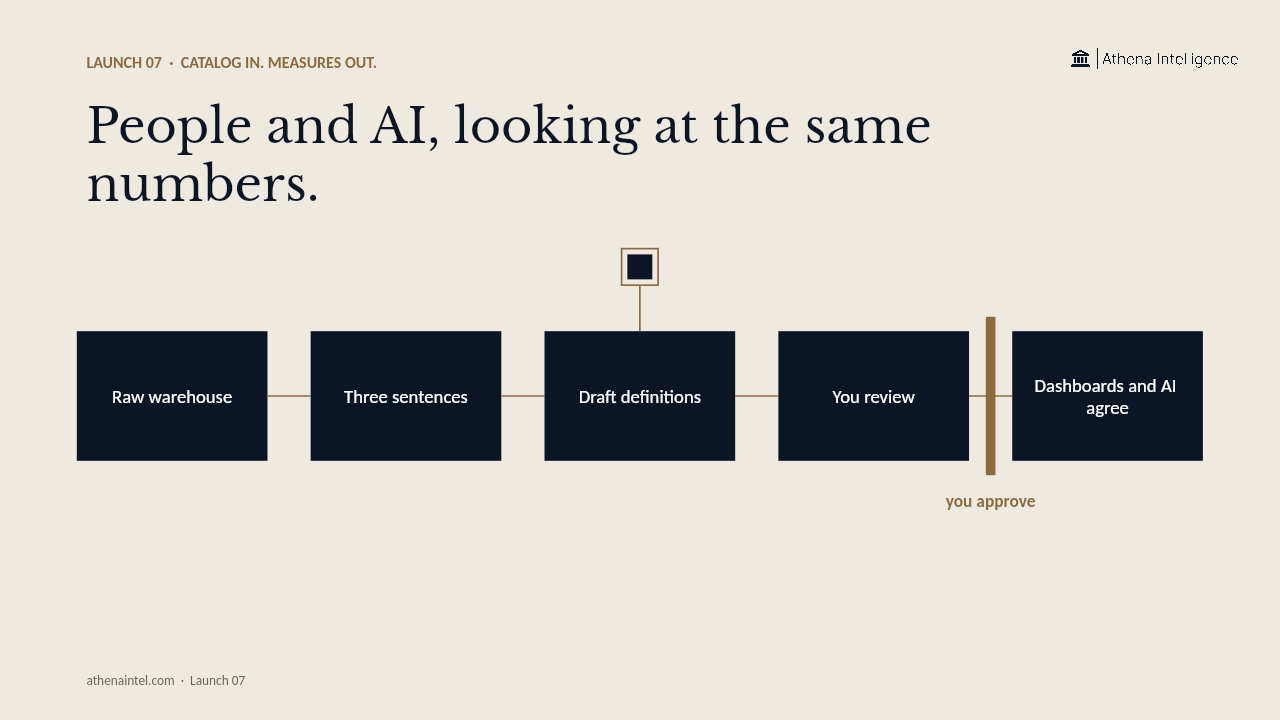
Point Athena at Snowflake, Databricks, BigQuery, or the Athena Lakehouse. It reads the raw catalog: tables, columns, existing relationships, and sample values. Then you describe the business in a few plain sentences. We sell parts to stores. Revenue is net of returns. A customer is a store, not a person.

From that catalog and that paragraph, Athena writes a first draft of your semantic model. It proposes dimensions: Store, District, Region, Part, Category, Vehicle. It proposes measures: Net Revenue, Units, Fill Rate. It proposes how the tables connect. Every definition shows the query behind it, the tables it came from, and the reasoning for each choice.

You review it like a document. Accept, edit, or ask why. Version it. Then dashboards, agents, Athena Sheets, and notebooks query through the model with each user's own warehouse permissions. The semantic model comes first; the SQL comes second. The dashboard and the agent are now consistent because they read the same dictionary.

01ConnectwarehouseSnowflake, Databores,BigQuery, Lakehouse02Describe thebusinessThree sentences inplain language03Review the draftDimensions, measures,joins with reasoninga person approves04PublishDashboards and agentsread the same modelOne answer from every system
Fig. 02Athena drafts the semantic model from the catalog and three sentences, you review it, and every query runs through it.

What you see on screen

On the left: a text pane where the data lead types the business context. On the right: the generated semantic model. Dimensions appear with their hierarchies. Store rolls up to District, District rolls up to Region. Part belongs to Category. Measures appear with their formulas. Net Sales excludes returns and adjustments. Each definition has a lineage arrow back to the catalog tables that feed it.

Controls sit beside each row. Accept takes the definition as written. Edit opens the formula and the reasoning. Ask why shows the sample values and column names Athena used to infer the relationship. If Athena cannot determine a join for certain, the row flashes amber with a flag: connection unclear. A person fills in the join key and approves.

Once you publish, the model is versioned. Every change has an author. Rollbacks are available. Dashboards, agents, sheets, and notebooks query through the model. Each query runs with the user's own warehouse permissions. The agent and the analyst see the same definitions, so they give the same answer.

ordersreturnsstoresregionsONE DEFINITIONNet Revenueorders.amount -returns.amountDashboardconsistentAgentconsistentsame number, both places
Fig. 03Every definition shows the query and the source tables; dashboards and agents query through the same model.

Ontology above the semantic model

Businesses talk in things, not tables. A brand, a plant, a legal matter, a deal. Athena models those as typed objects in an ontology that sits above the semantic model. A Brand object can answer a SQL question about sales and a document question about marketing strategy. One question pulls from the database and the document set at once.

A CPG provider's product lines lived in different systems. As typed objects in one ontology, the same question works across both. A law firm's clients, matters, people, and documents become objects with governed actions. Conflicts checks and knowledge management queries run against the same graph. Object types carry actions with policies. An agent can propose mark PO as disputed; a human approves; the action is versioned and reversible.

Every object type exposes a versioned API. Applications and external systems consume the same definitions the dashboards do. The ontology bridges the document world and the SQL world.

OntologyBrandPlantMatterDealSnowflakeDocumentsDashboardsAgentsTyped objects answer SQL and document questions
Fig. 04Typed objects in the ontology answer questions from databases and documents through one model.

Who it is for and what it replaces

Heads of data and analytics engineers. The team that keeps putting off the semantic model because building it by hand takes a quarter. Now it takes three sentences and a review session. If you already have a semantic layer in legacy BI or dbt, import it. Athena reads existing BI semantic model and can start from your dbt metrics. Then extend from there.

The semantic model replaces the dozen Measure files, wiki pages, and Slack threads where definitions live today. It replaces the meeting where someone asks which number is right, the dashboard or the agent. It replaces the guess the agent makes from column names when it has never seen your business logic. The model is yours. Export it. Data governance reviews; every change has an author; rollbacks are available.

Old wayOne modelMeasure fileWiki pageSlack threadSomeone's headDefinitions scattered and driftingSemantic modelVersioned and governedDashboards and agents read the same thing
Fig. 05The semantic model replaces the scattered definitions that make dashboards and agents disagree.
What customers say
“Lets us get a lot more out of our data than [...] We can sit on top of all of the data in [our data warehouse] as opposed to just, like, our little ingested, you know, three gigabytes semantic models. I think we have a lot of power here.”
Analytics lead · A Fortune 500 retailer
“Gave Athena the spreadsheet, explained which column I was trying to figure out, and then ten secs it told me... exactly how the calculation was based on the other data.”
Analyst · A global manufacturer
“He wrote the entire stuff. By itself. And I was there, and I was thinking, alright. If I had to write all this stuff, I mean, I would've spent days, days, days.”
Manufacturing analyst · A global manufacturer
“I send that to the programmer and he said, alright. I read your file. I copied the section of the code because he has the right interface, and it works. Wow. Just like magic.”
Manufacturing analyst · A global manufacturer
“One workspace. All different, let's say, avatars of their output data. Right? Suddenly, it's dashboard. Excel is here. PowerPoint is when it's all together. It's very impressive.”
Global Sustainability lead · A global manufacturer
“Digital worker, it gets spun up, it gets given access to the toolkits that it needs. It gets given access to the data that it needs. Just exists for the period it needs to exist to perform the task. And then it gets torn back down again afterwards.”
Audit lead · A global professional services firm
“I like that direction, that concept of the agent is the agent. It becomes an entity in its own right with its own ownership and its own missioning, and you get rid of the gray area and the blurry lines.”
Audit lead · A global professional services firm
“This combination is a winning combination for us, and this is where we see maximum traction, which is how do you apply all the intelligence that you have within [our data platform] and not worry about how you render that output.”
Analytics lead · A global CPG provider
“A lot of people are telling us that, oh, I sold in this package because of this info... I secured this distribution because of the selling assistance help.”
Sales enablement lead · A global CPG provider
“We have a variety of tools today that we have trails for, but not many of them can quickly and easily revert back to the previous versions.”
Partner · A global professional services firm

Verbatim from customer calls. Customers anonymized.

End to end

Draft a semantic model from a Snowflake catalog

SURFACES INWHAT COMES INTHE PLATFORMWHAT GOES OUTDELIVERED BACKMobile · voiceText (SMS)EmailSlack · TeamsChromeOffice add-inMeeting botMeetingsWordPowerPointSheetsFiles · PDFsDataAgentsWorkflows (AOPs)AppsLibrarySessionsSpacesStudiosMeetingsLakehouseDatabaseDashboardsWordPowerPointSheetsData · APIsApps · portalsMobile · voiceText (SMS)EmailSlack · TeamsChromeOffice add-inMeeting botWeb1Semantic models2Web3Dashboards41 INData lead opens Athena,connects to Snowflake, typesthree sentences about stores,parts, and revenue.2 RUNAthena reads the raw catalog,infers tables and lineage,drafts dimensions, measures,and joins with reasoning.3 REVIEWData lead reviews eachdefinition, accepts most,edits one flagged join keyon a legacy table.4 ANSWERDashboard and agent bothquery through the publishedmodel with user permissions;both show the same number.
Fig. 06The route on the system map: Web → Semantic models → Dashboards. Connectors: Snowflake catalog inspector · business context input · review UI
What it runs on